From the previous blog, I hope you might have got some idea about Qualitative Analysis for Equity. Fundamental analysis is one of the important aspect of selecting a stock. Further, fundamental analysis can be classified as Qualitative and Quantitative Analysis. Click here to read Qualitative Analysis for Equity. However, In this article, we are going to discuss Quantitative Fundamental Analysis.
Dear Reader, Welcome to SimplyRead! Yes, Here things are So Simple!
What is Quantitative Fundamental Analysis?
Quantitative Fundamental Analysis can be described as analyzing the stock based on the data which depicts the performance of the company. Simply put, stock analysis with numbers and calculations. Moreover, Using these data metrics, the intrinsic value of the stock can be easily calculated. Additionally, Intrinsic value is nothing but the true value of the stock. Ultimately, The goal of Quantitative fundamental analysis is to find the true value of the stock.
WHAT IS STOCK SCREENING?

I’m sure you would have heard the word “Screening” in medical terms. However, people who are involved in the stock market can be aware of this. In medical, Screening means conducting lab tests with blood samples or cells to detect the abnormality in the human body. Likewise, In the stock market, there is a method called Stock Screening.
Stock screening helps investors to find potential stocks. Similar to lab tests, Investors use the screening tool to filter the stocks based on certain conditions. Moreover, this tool can be made with simple excel software with a filter tool. However, there are private websites like Screener that will be user-friendly to filter stocks. Simply put, Stock screening helps to filter valuable stocks.
KEY METRICS
Analyzing the stock is a vast topic and involves a great number of metrics. However, We are going to take only the Key metrics into account. The following are the Key Metrics for stock analysis.

1.P/E RATIO
In P/E Ratio, P stands for price and E refers for Earning. Collectively, it is Price to Earning Ratio. Most investors consider P/E ratio as an important factor to select a stock. Sometimes, it is represented as PE TTM stands for Trailing Twelve Months PE. Moreover, It is nothing but the PE for one year (4 quarters).
![Rendered by QuickLaTeX.com \[ \boxed{P/E Ratio =\frac{Market \hspace{1} Price}{Earnings \hspace{1} per \hspace{1} Share}} \]](https://simplyread.co.in/wp-content/ql-cache/quicklatex.com-a5a29e61b8337f73c5ca178b632ba773_l3.png)
P/E ratio should be compared with the Sector PE to know its value.
2.SECTOR P/E
Sector P/E is the P/E ratio for a particular sector. Moreover, the sector means the category or industry the stock is related. For Example, Apple comes under the technology sector. Sector PE gives the average PE of all the stocks in a particular sector. Also, Stocks PE will be compared against the stocks PE to know its true value.
3.DIVIDEND YIELD %
Dividends are nothing but the profits of the company shared among the investors. Moreover, the company allocates a particular percentage to the number of stocks held by stockholders. However, dividends allotment depends on the company’s decision and performance, and it’s not mandatory to pay.
Similar to the P/E ratio, the Dividend yield also has Sector Dividend yield% used to compare the Dividend yield %.
4.P/B RATIO
In the P/B ratio, P stands for market price and B stands for Book value. Collectively, it’s called the Price to Book ratio. Also, Book value can be defined as the value of the stock according to the balance sheet. Simply put, the Book value of the company is the real value of the company after all depreciation. Similar to PE TTM, the PB ratio also has twelve-month average which is PB TTM. Moreover, the PB ratio also has Sector PB similar to the PE Sector ratio. It is derived by the following formula.
![Rendered by QuickLaTeX.com \[ \boxed{P/B Ratio =\frac{Market \hspace{1} Price \hspace{1} per \hspace{1} share}{Book \hspace{1} Value \hspace{1} Per \hspace{1} Share}} \]](https://simplyread.co.in/wp-content/ql-cache/quicklatex.com-c3a91c1ce3ceb1f0e085fb5f44677ebc_l3.png)
The P/B ratio should be compared with the Sector PB to know its value.
FINANCIALS
Financials are the financial reports released by the company for every quarter of a year. Moreover, Financial statements give the investor an idea of the company’s performance and prospects. In addition, the financial reports can be represented in the following forms for better understanding.
- Income
- Balance Sheet
- Cash Flow

1.INCOME
Income is used to measure the financial performance of the company over a reporting period. Moreover, it gives the over on the revenue, expense, profit, loss, etc. It is also called a P&L statement. The metrics involved in the income statement are as follows
->TOTAL REVENUE
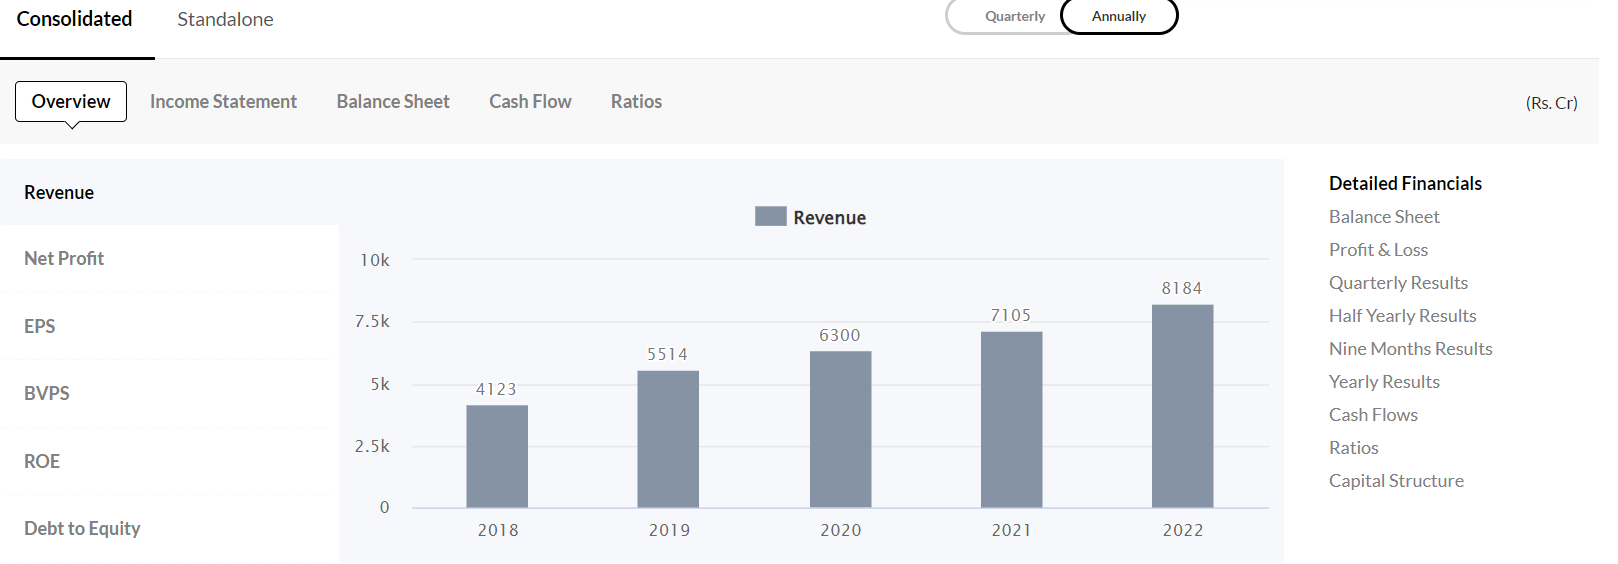
Total revenue is the income generated by the company for selling its products or services. The revenue in an increasing trend shows the company is performing well
->EBITDA
EBITDA means the earnings of the company before Interest, Tax, and Depreciation. It is used to analyze the company’s performance. Here is how EBITDA is derived as follows.
![]()
Here, Depreciation refers to the loss of asset value over time. Amortization refers to the method used to reduce the asset value.
->PBIT
PBIT or Profit Before Interest and Tax is the sum of the Net profit of the company, Interest, and taxes. Moreover, if taxes are excluded it is also called PBT. Ultimately, net income is derived by deducting the PBIT from taxes and other factors.
![]()
->EPS
EPS or Earnings Per Share represents how much the company is earning per outstanding share. Simply put, If you hold a share of Apple, EPS is the company’s earnings per share. Also, it is represented by the formula as follows.
![Rendered by QuickLaTeX.com \[ \boxed{EPS =\frac{Total \hspace{1} Earnings}{Outstanding \hspace{1} Shares}} \]](https://simplyread.co.in/wp-content/ql-cache/quicklatex.com-96eae1a774fa275824b4409caf9bb8f0_l3.png)
->DEBT TO EQUITY RATIO
The debt to Equity ratio is the relative proportion of the Company’s Debt involved for finance to the Shareholder’s Equity. Moreover, it helps us to find the amount of Debt the company needs to repay. Debt means the liability the company owes to a bank or financial institution.
->RETURN ON EQUITY (ROE)
Return on Equity is the relative proportion of the company’s income to the shareholder’s equity. Simply put, it shows the company’s income derived from the shareholder’s equity.
![Rendered by QuickLaTeX.com \[ \boxed{ROE =\frac{Net \hspace{1} Income}{Shareholder's \hspace{1} Equity}} \]](https://simplyread.co.in/wp-content/ql-cache/quicklatex.com-df558c1c99b92428bc49b16c30707e82_l3.png)
->RETURN ON ASSET (ROA)
Return on Asset is the relative proportion of the company’s net income to the company’s net Asset. Moreover, Assets mean the security or property that the company owns exclusively.
![Rendered by QuickLaTeX.com \[ \boxed{ROA =\frac{Net \hspace{1} Income}{Net \hspace{1} Asset}} \]](https://simplyread.co.in/wp-content/ql-cache/quicklatex.com-04dccf282f1e154e269edf157a740ed1_l3.png)
2.BALANCE SHEET
The balance sheet is a type of financial report that represents a company’s assets, Liabilities, and shareholders’ equity. Moreover, Analyzing the balance sheet should be a vast topic to discuss. However, Let us discuss this in brief. Here are the important metrics as follows.

->TOTAL ASSESTS
The asset is nothing but the properties or belongings or securities which you own exclusively. For example, buying a house on a lumpsum amount without any loan or mortgage from a bank or financial organization. Therefore, total assets mean the total asset the company owns without any collateral.
The asset should be increasing trend and without negatives.
->LIABILITIES
Liabilities are the properties or belongings or security which you owe to other financial institutions or any financial distributor. For example, Buying a house with the help of a housing loan. Although you pay loan EMI every month, the house is still owned by the loan provider. Therefore, it is called liability. Likewise, Companies get funds from financial institutions to improve their business. Thus, these funds are a liability for the company.
Liability should be in decreasing trend compared to previous years
->TOTAL EQUITY
Total equity is the number of stocks invested by the investors, other earnings of the company subtracted by the dividends payout. In other words, Total equity is the difference between the Total Asset and Total Liability. Moreover, when the total equity increases it indicates that the company’s performance is increasing. Also, in other words, shareholders are increasing relative to the company’s performance.
![]()
3.CASHFLOW
Cash flow is the total flow of cash in and out of the company. Further, Cashflow of the company describes healthy business operations involving more transactions. This can be analyzed using the below metrics.
->NET CHANGE IN CASH
The net change in cash is the change in cash and cash equivalents after the reporting period. In other words, it is the sum of Cash from operating activities, Cash from Investing activities, and Cash from financing activities
![]()
->FREE CASH FLOW
Free cash flow (FCF) is the leftover cash available with the company after all expenses and settlements. Moreover, Dividends are paid from the free cash available.
REFERENCE VALUE
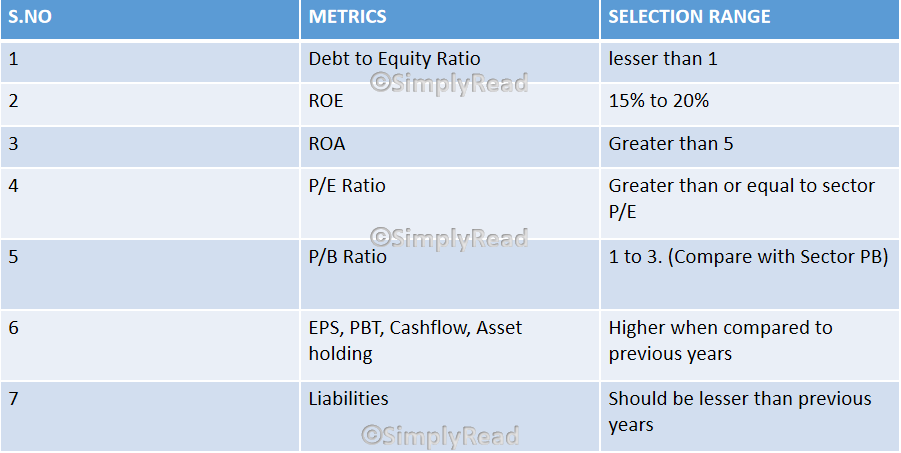
The following gives the reference value of these metrics. However, these values are approximate and may work to a better extent. As always, SimplyRead suggests “Do your analysis before deciding to invest”.

TO WRAP THINGS UP
Hope you have got a good idea of the Quantitative Analysis and its metrics evaluation.
Moreover, Simply Read suggests making your analysis and watching the stock movement for a few days. As a result, It may help you to evaluate your analysis skill.
Post your Analysis for stocks in the comment box! So Simple!


1 comment