While hearing about the stock market what comes to your mind? More complex bars and charts? If yes, you’re in right place. Technical Analysis for Stock is a method of analyzing and predicting the price movement of stocks. Moreover, technical analysis is one of the important tools to analyze the stock market. Also, It’s not complex to gain knowledge of technical analysis. Furthermore, If you think only experts do technical analysis, then Click here
Dear Reader, Welcome to SimplyRead! Yes, here things are So Simple!
WHAT IS TECHNICAL ANALYSIS?
As already said, Technical Analysis is a method of analyzing and predicting the stock price movement. Moreover, certain values or metrics, and strategies can help. Further, it is used to predict the price trend of the stock. Usually, Stock Analysis can be divided into two types. They are Fundamental analysis and Technical analysis. Read about Qualitative and Quantitative Fundamental analysis.
FUNDAMENTAL ANALYSIS VS TECHNICAL ANALYSIS
Fundamental Analysis will give an idea about the company’s fundamentals such as the financial statements of the company. Whereas, technical analysis helps to predict the stock price movements or direction. For example, An investor who plans to invest may use fundamental analysis to determine the value of the stock whereas technical analysis to find the right time to invest.

Fundamental and Technical analysis should go together like a couple!
FACTORS AFFECTING TECHNICAL ANALYSIS
There are several factors or aspects on which technical analysis is made. Although, we are going to discuss the most important factors for Technical analysis. Moreover, following these factors helps stock selection to be quicker and simple.
1.CHARTS
A Chart is a graphical representation of data. Moreover, Chart in the Stock market helps the investors to view the price change of stock over the time. Additionally, the charts are represented in the form of candles. It visualizes the price change over a different period of time. Moreover, the charts can be viewed on separate websites such as tradingview, Invetsing.com, etc. Otherwise, you can directly view the charts in your Demat account. Click here to learn more about Demat account.
2.GREEK METRICS
In technical analysis, there are four types of metrics used. However, investors usually need to take care of alpha and Beta. Trading involves Theta, Gamma, delta, and sigma. There is a mathematical expression involved in these metrics. But, we are just going to learn its purpose.
->ALPHA(α)
Alpha is represented as the symbol α. It is used to calculate the performance of the stock. To be precise, α shows how the stock has outperformed the indices of the stock market. Moreover, Indices mean NIFTY 50, S&P 500, etc. Click here to read the basics of the stock market to know about indices. An alpha value above 1.0 is considered a good-performing stock. Moreover, it represents that the stock outperformed the benchmark index by 1%
->BETA(β)
Beta is represented as the symbol β. It is used to calculate the volatility of a stock. What is volatility? Volatility means the rate of change in stock price over some time. To put it simply, how rapidly the stock price changes over time. Moreover, a β value of <1.5 for a stock is considered as less volatile. Choosing the less volatile stocks for long-term investment is wiser than more volatile stocks.
For Options, Sigma represents the volatility of the stock option. But, it’s rarely used.
->DELTA(δ) AND GAMMA(γ)
Delta and Gamma are Greek metrics used for derivative analysis. Moreover, derivatives are futures and options and not equity investment. If you’re only into investing you don’t need to care about these. Firstly, Delta is the change of option price for a change in the $1 value of the underlying stock. Gamma is the rate at which delta changes for the $1 value of the underlying stock.
Delta is the speedometer and Gamma is the accelerator for change in option price
->THETA(θ)
Theta is also used for derivative analysis. Moreover, Theta is also called a time-decay because it indicates the decay of an option’s price over time. Usually, the value of theta will be negative. To put it simply, when the option nears to expiry date the more negative theta value will be. For option buyers, it’s better to sell before theta decay whereas for option sellers theta decay is an advantage.
3.TREND
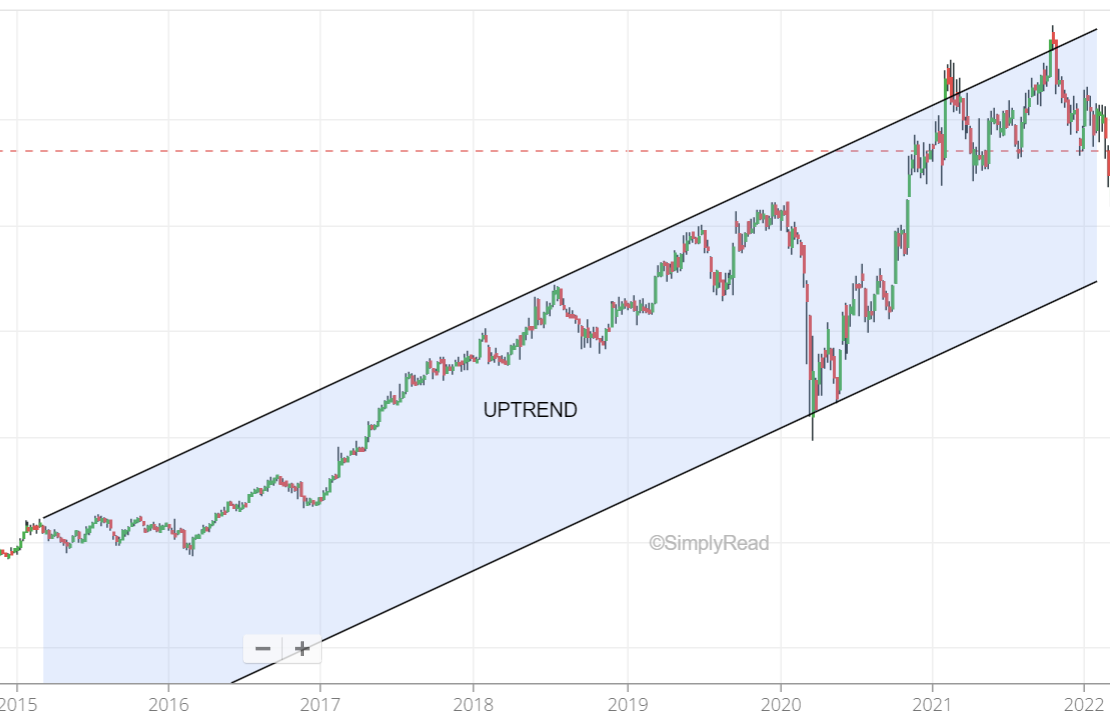
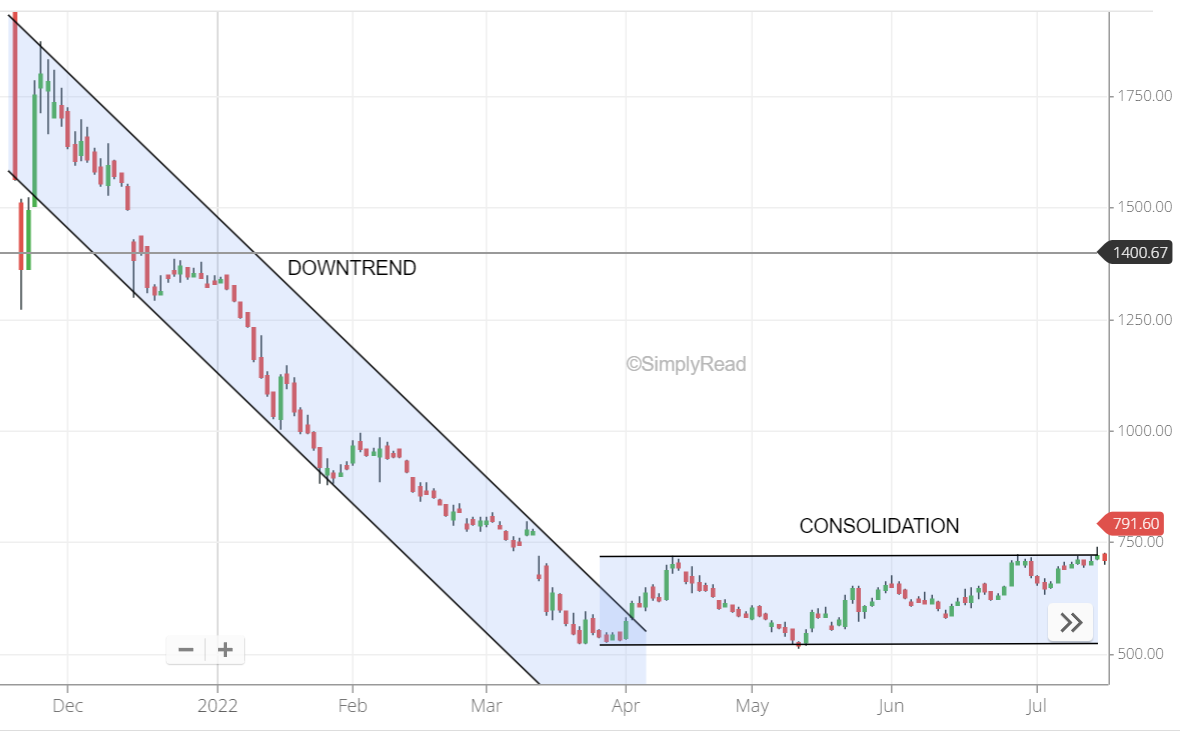
A trend is the direction of stock price movement. Moreover, when the stock prices rise continuously for a certain time frame it is called an Uptrend or Bullish. On the contrary, If the stock price falls continuously for a period it is called a Downtrend or Bearish. However, the trend should be confirmed based on the time frame. Also, this time frame depends on the terms of investment such as long and short term. Moreover, if the trend is flat within a particular range, then it is Sideways or Consolidation.
For example, Long term investors can predict the trend with the monthly chart. Whereas, a short-term investor can predict the trend with the weekly or monthly chart. Sometimes, myths try to deceive trends. Click here to read about myths about the stock market.


4.SUPPORT
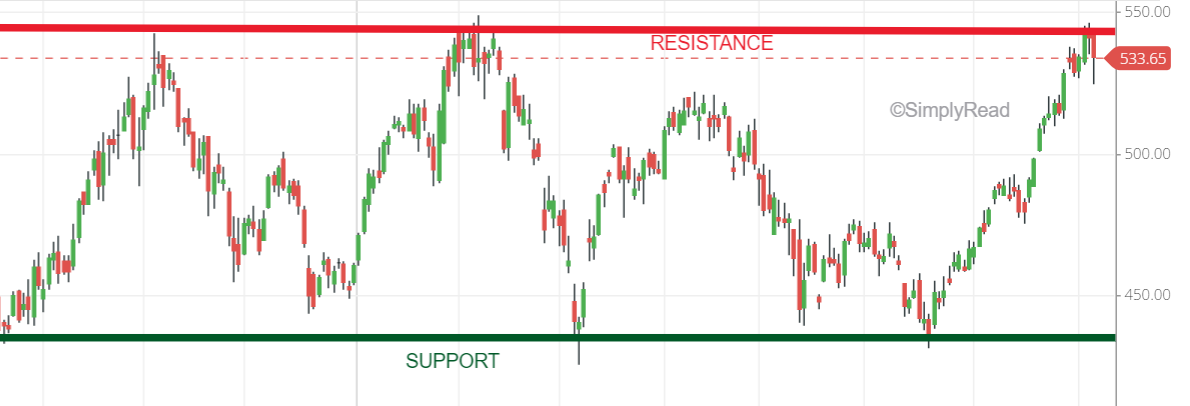
Support is the point in the chart where the stock price stops falling and bounces back. To put it simply, Support is the price level that acts as a support for the falling stock. Moreover, Support and resistance are the most important factor to determine the trend of the stock. Also, Buyers usually buy stocks at support level thinking that the stock can start rising. Finally, watching the historical support points (last week, day, or month) can help to find the support level.

5.RESISTANCE
Resistance is the quite opposite side of Support. Moreover, it is the point at which the stock price reaches saturation and stops rising furthermore. Also, Sellers usually sell the stocks at this level thinking that the stock is ready to fall. Similar to Support, historical resistance points or previous highs can be compared for finding resistance.
6.VOLUME
Volume can be defined as the quantity of stocks bought and sold on a day or during any time frame. Moreover, the volume helps to predict the trend of the stock price movement. Additionally, volume shows the interest shown by buyers and sellers on the stock making it active. Here is the cheat sheet to analyze volume in simple terms.
| SL.NO | PRICE | VOLUME | TREND |
|---|---|---|---|
| 1 | Increases | Increases | Bullish – Heavy Buying |
| 2 | Increases | Decreases | Cannot be determined- Light Buying |
| 3 | Decreases | Increases | Bearish- Heavy Selling |
| 4 | Decreases | Decreases | Cannot be determined- Light Selling |
7.INDICATORS
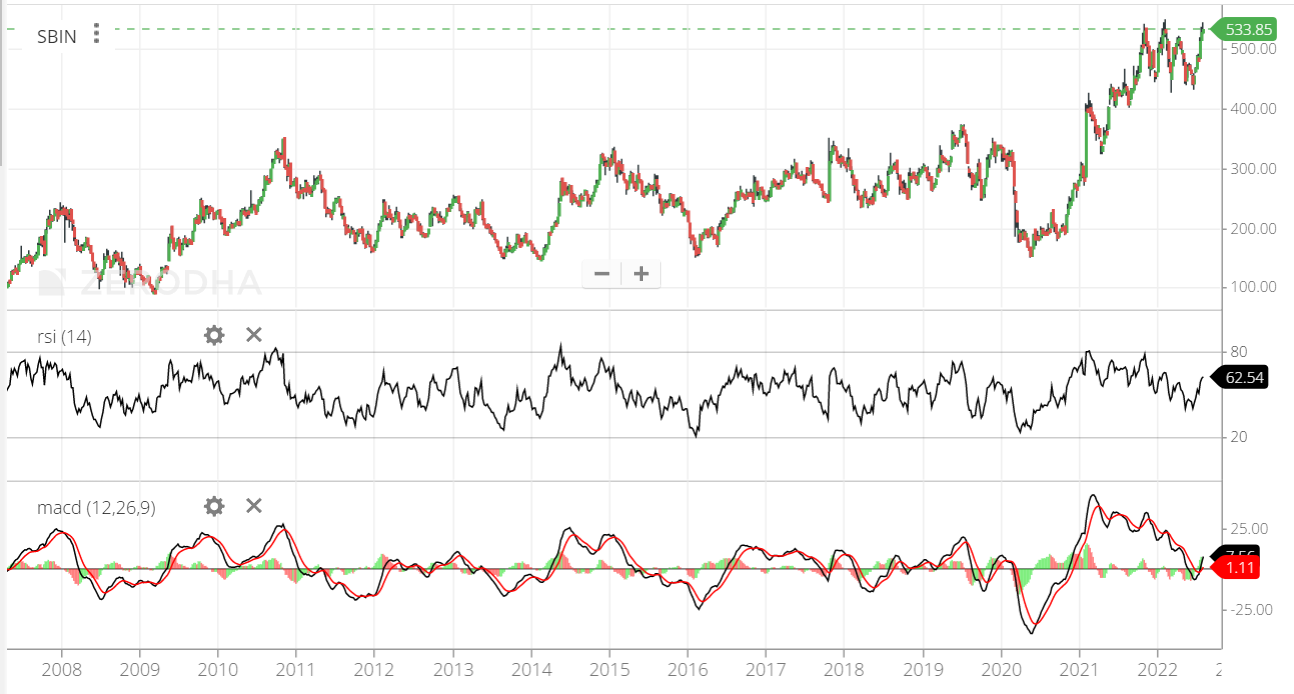
An indicator is a software tool that helps to predict the stock movement, Volume, buy and sell signal, and a lot more. Moreover, Indicator is user-friendly and helps investors to get rid of complex calculations. Some of the popular Indicators are Bollinger Bands, RSI, stochastic, Moving average, MACD, etc., Of all, My favorite would be the combination of RSI, MACD, and Bollinger bands(optional). With indicators, technical analysis can be made in no time like Maggie noodles.

TO WRAP THINGS UP!
I hope you have got some basic idea on Technical analysis of stocks. Do technical analysis on a stock and post it in the comment box!
What stock you’re going to analyze first?
Thanks for reading! So Simple!


3 comments